


Choosing the Right Charts for Your Custom Marketing Reporting
Data Visualization is the creative side of reporting.
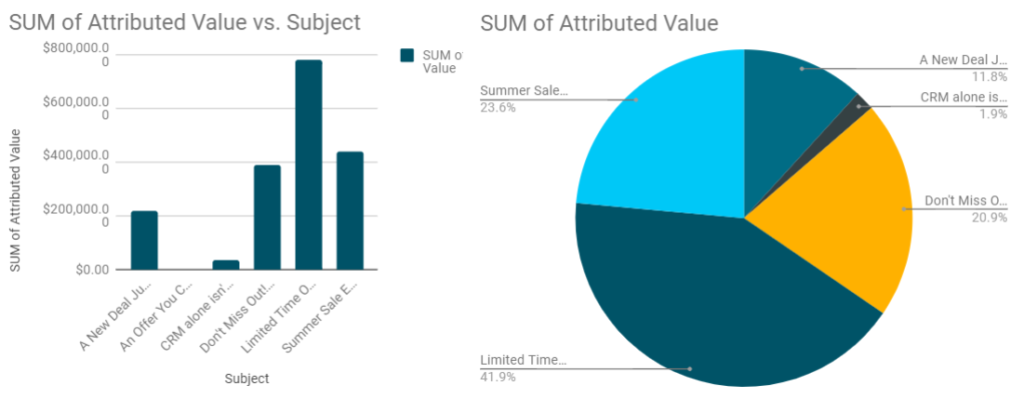
It’s the pretty charts and graphs that your colleagues “ooo” and “aww” over in team meetings. When done right, you can set the standard by which others are measured. However, many marketers are not also data analysts and therefore struggle to develop effective data visualizations for their reports. Consider this example: Mary wanted to show the revenue generated from her marketing campaigns with an emphasis on which campaigns had contributed most significantly to accomplishing their companies quarterly revenue goals. She had tracked and measured the data, but the monochromatic bar chart she used just didn’t seem to tell the story. After a brief consultation, she realized that since her goal was “to compare the success of campaigns” a visualization highlighting comparison was more appropriate, in this case, a pie chart. While either would work, the pie chart is more effective and helping others understand the data by representing the relative contribution visually.
So, What Graph Should I Use?
There are many, many ways to visualize data. The best tool for your purposes depends largely on your audience and the meeting context. Many marketers have had their data challenged due to a lack of granularity, and many have had ignored it for being too specific or jargony. The most important thing is that your data visualization be effective! Here are some basic considerations* for determining the type of chart you should use:
Line Graph
Line graphs are used to track changes over short and long periods of time. When smaller changes exist, line graphs are better to use than bar graphs. Line graphs can also be used to compare changes over the same period of time for more than one group.
Pie Chart
Pie charts are best to use when you are trying to compare parts of a whole. They do not show changes over time.
Bar Graph
Bar graphs are used to compare things between different groups or to track changes over time. However, when trying to measure change over time, bar graphs are best when the changes are larger.
Area Graph
Area graphs are very similar to line graphs. They can be used to track changes over time for one or more groups. Area graphs are good to use when you are tracking the changes in two or more related groups that make up one whole category (for example public and private groups.)
X-Y Plot
X-Y plots are used to determine relationships between the two different things. The x-axis is used to measure one event (or variable) and the y-axis is used to measure the other. If both variables increase at the same time, they have a positive relationship. If one variable decreases while the other increases, they have a negative relationship. Sometimes the variables don’t follow any pattern and have no relationship.
Summary
Visualization in Data Analysis is an entire field of its own. This specific post is not meant to be exhaustive (that is to come), but, as always, feel free to contact us for a free consultation!
*Source: https://nces.ed.gov/nceskids/help/user_guide/graph/help_menus.asp
